BAI calculator with BMI comparison
This is an interesting real-life application of graphs of functions. For background on this calculator, see New measure of obesity – body adiposity index (BAI).
Enter your age, gender, height, weight, and hip circumference ("at the level of the maximum extension of the buttocks posteriorly in a horizontal plane") below. (Some typical values are given.)
[If you still think in feet, pounds and inches, you can convert your measurements to metric here.]
BMI Result
At 1.75 m tall and 80 kg your BMI is:
BMI = 26.1 kg/m2
| Weight Status | BMI |
|---|---|
| Underweight | Below 18.5 |
| Normal | 18.5 – 24.9 |
| Overweight | 25.0 – 29.9 |
| Obese | 30.0 and Above |
Your BMI weight status:
BAI Result
At 1.75 m tall and hip 100 cm, and being male, your BAI is:
BAI = 25.2% body fat
| Status | BAI Male 20 to 40 |
BAI Female 20 to 40 |
|---|---|---|
| Underweight | < 8% | < 21% |
| Healthy | 8 to 19% | 21 to 33% |
| Overweight | 19 to 25% | 33 to 39% |
| Obese | > 25% | > 39% |
Your BAI weight status:
Formula for BMI
`\text{BMI}` `=\frac{\text{weight in kg}}{\text{(height in m)}^2}`
Formula for BAI
`\text{BAI}` `=\frac{\text{hip in cm}}{\text{(height in m)}^{1.5}}` `-18`
Points to Note and Disclaimer
The above cut-off values for the BAI (% body fat) are based on this table.
Determining your body fat from height, weight and hip measurements (and your health status) is certainly not an exact science! Go to your doctor and get proper body fat measurements done before acting on anything above.
Graphs of BMI and BAI
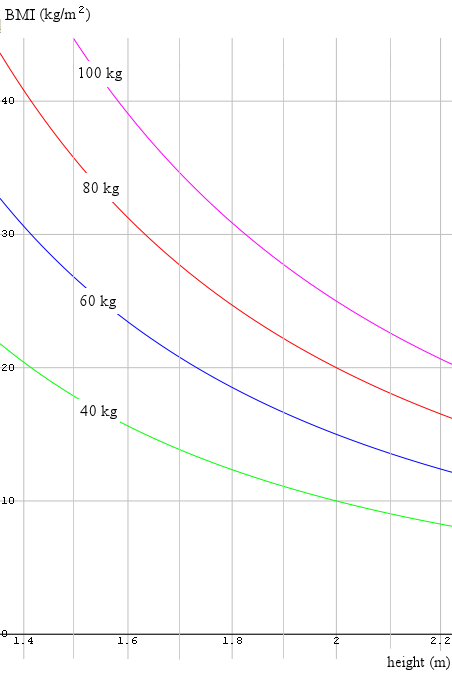
The following graph shows the BMI for various weights (40 kg in green, 60 kg in blue, 80 kg in red and 100 kg in magenta).
Here now is the BAI, for typical hip measurements ranging from 70 cm (in green) through to 130 cm (in magenta).
Graph of BAI for various hip girths.
Graphs of the Functions
For completeness, let's zoom out and see the graphs of the BMI and BAI functions.
BMI: The graphs of
`y=n/x^2`
for various `n` each have 2 arms. The domain is all x except x = 0 and the range is y > 0.
Graphs of `y=n/x^2` for `n=40,60,80,100`.
BAI: The graphs of
`y=n/x^1.5 - 18`
for various `n` have only one arm, since the square root of a negative number is not defined for the real numbers. This is an issue since `x^1.5 = xsqrt(x)`, in the denominator (bottom) of the fraction. In this case, the domain is x > 0 and the range is y > -18.
Graphs of `y=n/x^1.5-18` for `n=70,90,110,130`.
See more on domain and range.
Of course, for the BMI and BAI graphs, we only consider positive values for the height, BMI and BAI, since negative values have no practical meaning.
Any comments? Go to: New measure of obesity - body adiposity index (BAI) and leave your thoughts.
