Hyperbola - Interactive Graphs
You can explore various hyperbola graphs on this page, and see the effect of changing parameters (by dragging various points around).
For background information on what's going on, and more explanation, see:
a. Interactive Graph - "North-South" hyperbola
We learned on The Hyperbola page that a hyperbola is the locus of (or the "path traced out by") a point where the difference of the distances from 2 fixed points is a constant.
You can explore what this means in the following JSXGraph (it's not a fixed image).
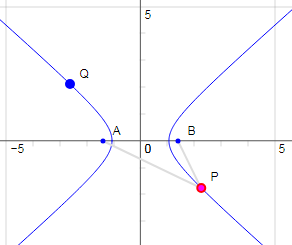
This is the same as the first example given on The Hyperbola page. In this case the equation of the hyperbola is:
`y^2-x^2/3=1`
A hyperbola has 2 focus points, shown as points A and B on the graph (these points are fixed for this first interactive).
Things to do
- You can drag point P around the hyperbola to investigate the property that Length PB − Length PA is constant for a particular hyperbola.
In this example, PB − PA = 2. - You can also drag the point P down to the bottom arm of the hyperbola and note the difference (PA − PB), (reversed this time), also equals 2.
- You can drag point Q, which will change the shape of the hyperbola.
- Finally, you can view the asymptotes of the hyperbola.
Show asymptotes
b. Interactive Graph - "East-West" hyperbola
This next graph is the same as Example 3 on The Hyperbola page. It shows the "East-West" hyperbola `x^2-y^2=1`.
Things to Do
- Once again, you can drag point P around the hyperbola to investigate the property that Length PA − Length PB is constant for a particular hyperbola.
In this example, as in the one above, PA − PB = 2. - You can also drag the point P to the left arm of the hyperbola and note the difference (PB − PA), (reversed this time), equals 2.
- You can drag point Q, which will change the shape of the hyperbola.
- Finally, you can view the asymptotes of the hyperbola.
Show asymptotes
If for any reason you can't see the interactive applet above, here's a screen shot:
Screen shot - interactive hyperbola graph
c. Equilateral hyperbola
This next graph is the same as Example 5 on The Hyperbola page. It is the equilateral (or rectangular) hyperbola `xy=1`.
In this case, the asymptotes are the `x`- and `y`-axes, and the focus points are at `45^"o"` from the horizontal axis, at `(-sqrt2, -sqrt2)` and `(sqrt2, sqrt2)`.
The vertices of the hyperbola are at `(-1,-1)` and `(1,1)`.
Things to do
- Drag point P around the hyperbola to see that Length PA − Length PB = 2√2 ≈ 2.8 is constant for this hyperbola. (The value of the decimal jumps between close values due to rounding.)
- You can drag point A, one of the focus points, which will change the shape of the hyperbola. (Point A's movement is restricted along the line `y=x`, so we'll still have an equilateral hyperbola.)
d. "Free" hyperbola
This next graph is the same type as Example 7 on The Hyperbola page, where the axes are shifted and rotated.
The points A and B are focus points of the hyperbola, and point Q is a point on the hyperbola.
Things to do
You can drag any of the points A , B (the focus points) or Q (a point on the hyperbola) to create any shaped hyperbola, with rotated and shifted axes.